The Open Web Platform (OWP) is a platform for innovation, consolidation and cost efficiencies focused on those things happen within or intersect the actions of the Web browser.
It's a contract readable by developers and authors!
Recommendations, standards, notes, ...
Algorithms, technologies, implementations, ...
APIs, vocabularies, ...
Shared expectations!
And so why doesn't this work for Science on the Web? Or does it?
Problem Statement
We want to lower the bar for publishing scientific data on the Web so that we enable the network effect while still retaining some aspect of semantics and interoperability.
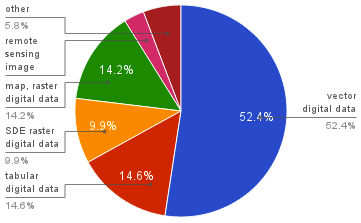
~500K datasets from data.gov, May 8th, 2012
many data sets are tabular
representation formats predate the Web
incompatible with browser technologies
archives of data sets
too large to be processed
Changing the Paradigm
Let's use the Web "as is"
A methodology for publishing scientific data sets onto the Web so that they are accessible in Web-oriented formats.
HTML has table markup so why can't we use it?
Name things with URIs! Develop a usable naming strategy for data sets on the Web; identifiable and easily retrievable.
Why not just use XML?
The International Virtual Observatory Alliance (IVOA) and others have tried that.
Random XML has its limitations (poor support?) on the Web and in the browser.
That's a problem.
The Three Little Problems
Once upon a time, there were three little problems...
Too big: Data sets are typically too large to be processed by the typical Open Web Platform (OWP) implementation as one large Web resource.
Too dumb: HTML table markup lacks the constructs to convey all the information coded within typical tabular data sets.
Too forgetful:
Accessing data may require formulating complex queries or URIs which is error prone. Users can request too much data which results in failures or requires
paging results.
Where's the smart with the brick house?
Or was he dinner?
The PAN Methodology
Partition the data set along properties inherent in the data (e.g. time, geospatial coordinates, etc.) into reasonable sized subsets suitable to Web applications.
Annotate the data according to some ontology and encode in a common syntax (HTML) using RDFa.
Name each data partition with a unique URI using a consistent naming scheme that can be traced back to your partitioning scheme from (1).
Seems obvious? Not to some...
Simple is good but questions remain:
Partitioning is fixed. No paging! No custom queries!
Yet, which choices are partitions are correct for your data?
Annotations via RDFa is new! What is the right way? Whose ontology?
// (1) Find the element that holds the partition
var datasets = document.getElementsByType("pan:Partition");

// (2) Use the subject to find the partition's item subjects
var items = document.data.getValues(datasets[0].data.id,"pan:item");

// (3) Access the first item (a table)
var table = document.getElementsBySubject(items[0])[0];
Find a column:
var columns = document.data.getValues(table.data.id,"pan:column");
var column = null;  // A variable to hold the subject URI.

for (var i=0; !column && i<columns.length; i++) {
  // Find the column labeled with the air temperature property
  if (document.data.getValues(columns[i],"pan:property")
        .indexOf("http://mesonet.info/airTemperature")>=0) {
     column = columns[i];
  }
}

// Find the index by finding the column element by subject URI.
var index = document.getElementsBySubject(column)[0].cellIndex;
Processing Data with Map / Reduce
We can map resources containing data to resultants.
We can reduce resultants to answers.
...and we can do it all in the browser!
The smart pig uses map / reduce!
Query & paging gets you all tied up.
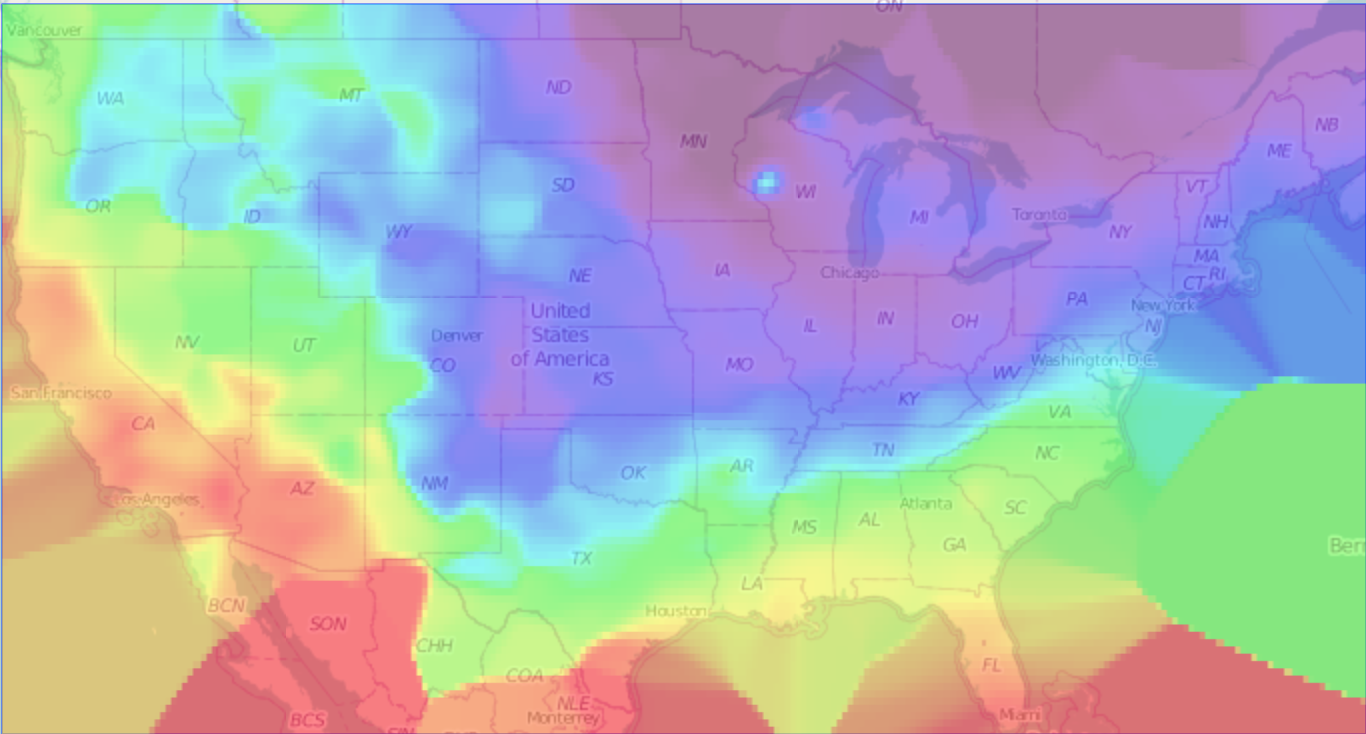
Barnes Interpolation
Iterative weighted averages based on observed values:
where
There will be a test later!
It produces the typical colored gradient of surfaces for temperature etc. for using in
visualizations (e.g. over maps).
Think: the weather report on the 10pm news.
Interpolation Process via Map / Reduce
Run it Live!
For
/
°
at for minutes
coloring by range (°C, °C)
with quadrangle size °.
Polar Vortex - 2014-01-23
22 seconds to render, 13.6 seconds data access.
240 Partitions
Polar Vortex Animation
Loading ...
Concluding Remarks
One cannot underestimate the value of view source in the development of the Web.
We want to extend this to both scientific data:
enables the copy and modify model
allows good constructs to go viral on the Web
What will the hacker in the corner will do with scientific data?